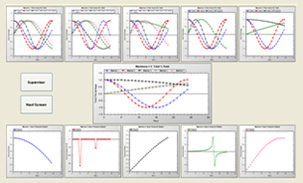
Our in house designed SCADA system can provide clients with an extremely useful Real time production monitoring tool at a very competitive cost. We can display companies’ data in Real time, in this case yield and production statistics, in a graphical format, saving the data produced to a server.
An example of our SCADA system integrated into a customer’s site shows how the production monitoring software is helping to improve yield by allowing the production team to identify problems earlier and react quicker to resolve them.
The ‘Yield Tracker’ software system can be integrated into most PLC based systems with Ethernet capability. The data collection takes place over the course of the shift and is displayed on the main screen (shown above), the data from multiple machines can be seen with the use of a slideshow function which displays each of the graphs and/or the overview pictured above in a full screen format for a user defined time. A large flat screen display or projector is then used to provide real-time feedback to the employees and management. Management can also view the ‘Yield Tracker’ from their desktops. At the end of the shift the data is stored to a server to allow further in depth analysis of the production period and allows cross checking of stock levels. Graphical ‘Target Yield’ and ‘Production levels’ help to indicate trends and quickly diagnose issues with the visual indicators providing that drive to fix the problem as it is occurring instead of looking at rows of raw data
where trends are easily disguised.
The ‘Yield Tracker’ software system can be integrated into most PLC based systems with Ethernet capability. The data collection takes place over the course of the shift and is displayed on the main screen (shown above), the data from multiple machines can be seen with the use of a slideshow function which displays each of the graphs and/or the overview pictured above in a full screen format for a user defined time. A large flat screen display or projector is then used to provide real-time feedback to the employees and management. Management can also view the ‘Yield Tracker’ from their desktops. At the end of the shift the data is stored to a server to allow further in depth analysis of the production period and allows cross checking of stock levels. Graphical ‘Target Yield’ and ‘Production levels’ help to indicate trends and quickly diagnose issues with the visual indicators providing that drive to fix the problem as it is occurring instead of looking at rows of raw data
where trends are easily disguised.